Playfair's work led to a veritable explosion of graph making in the 1800s. Graph hipsters among you will be familiar with Charles Minard's flow-map describing Napoleon's invasion of Russia in 1812. Created in 1869, modern-day graph maven Edward Tufte called it "the best statistical graphic ever drawn". The main variables it conveys are army size, spatial location, temperature and time. The beige line is the army on its way to Moscow, the black line is the return journey. The most striking thing about it is the incredible shrinkage of le Grande Armée as the Russians chip away at it for 6 months.
 |
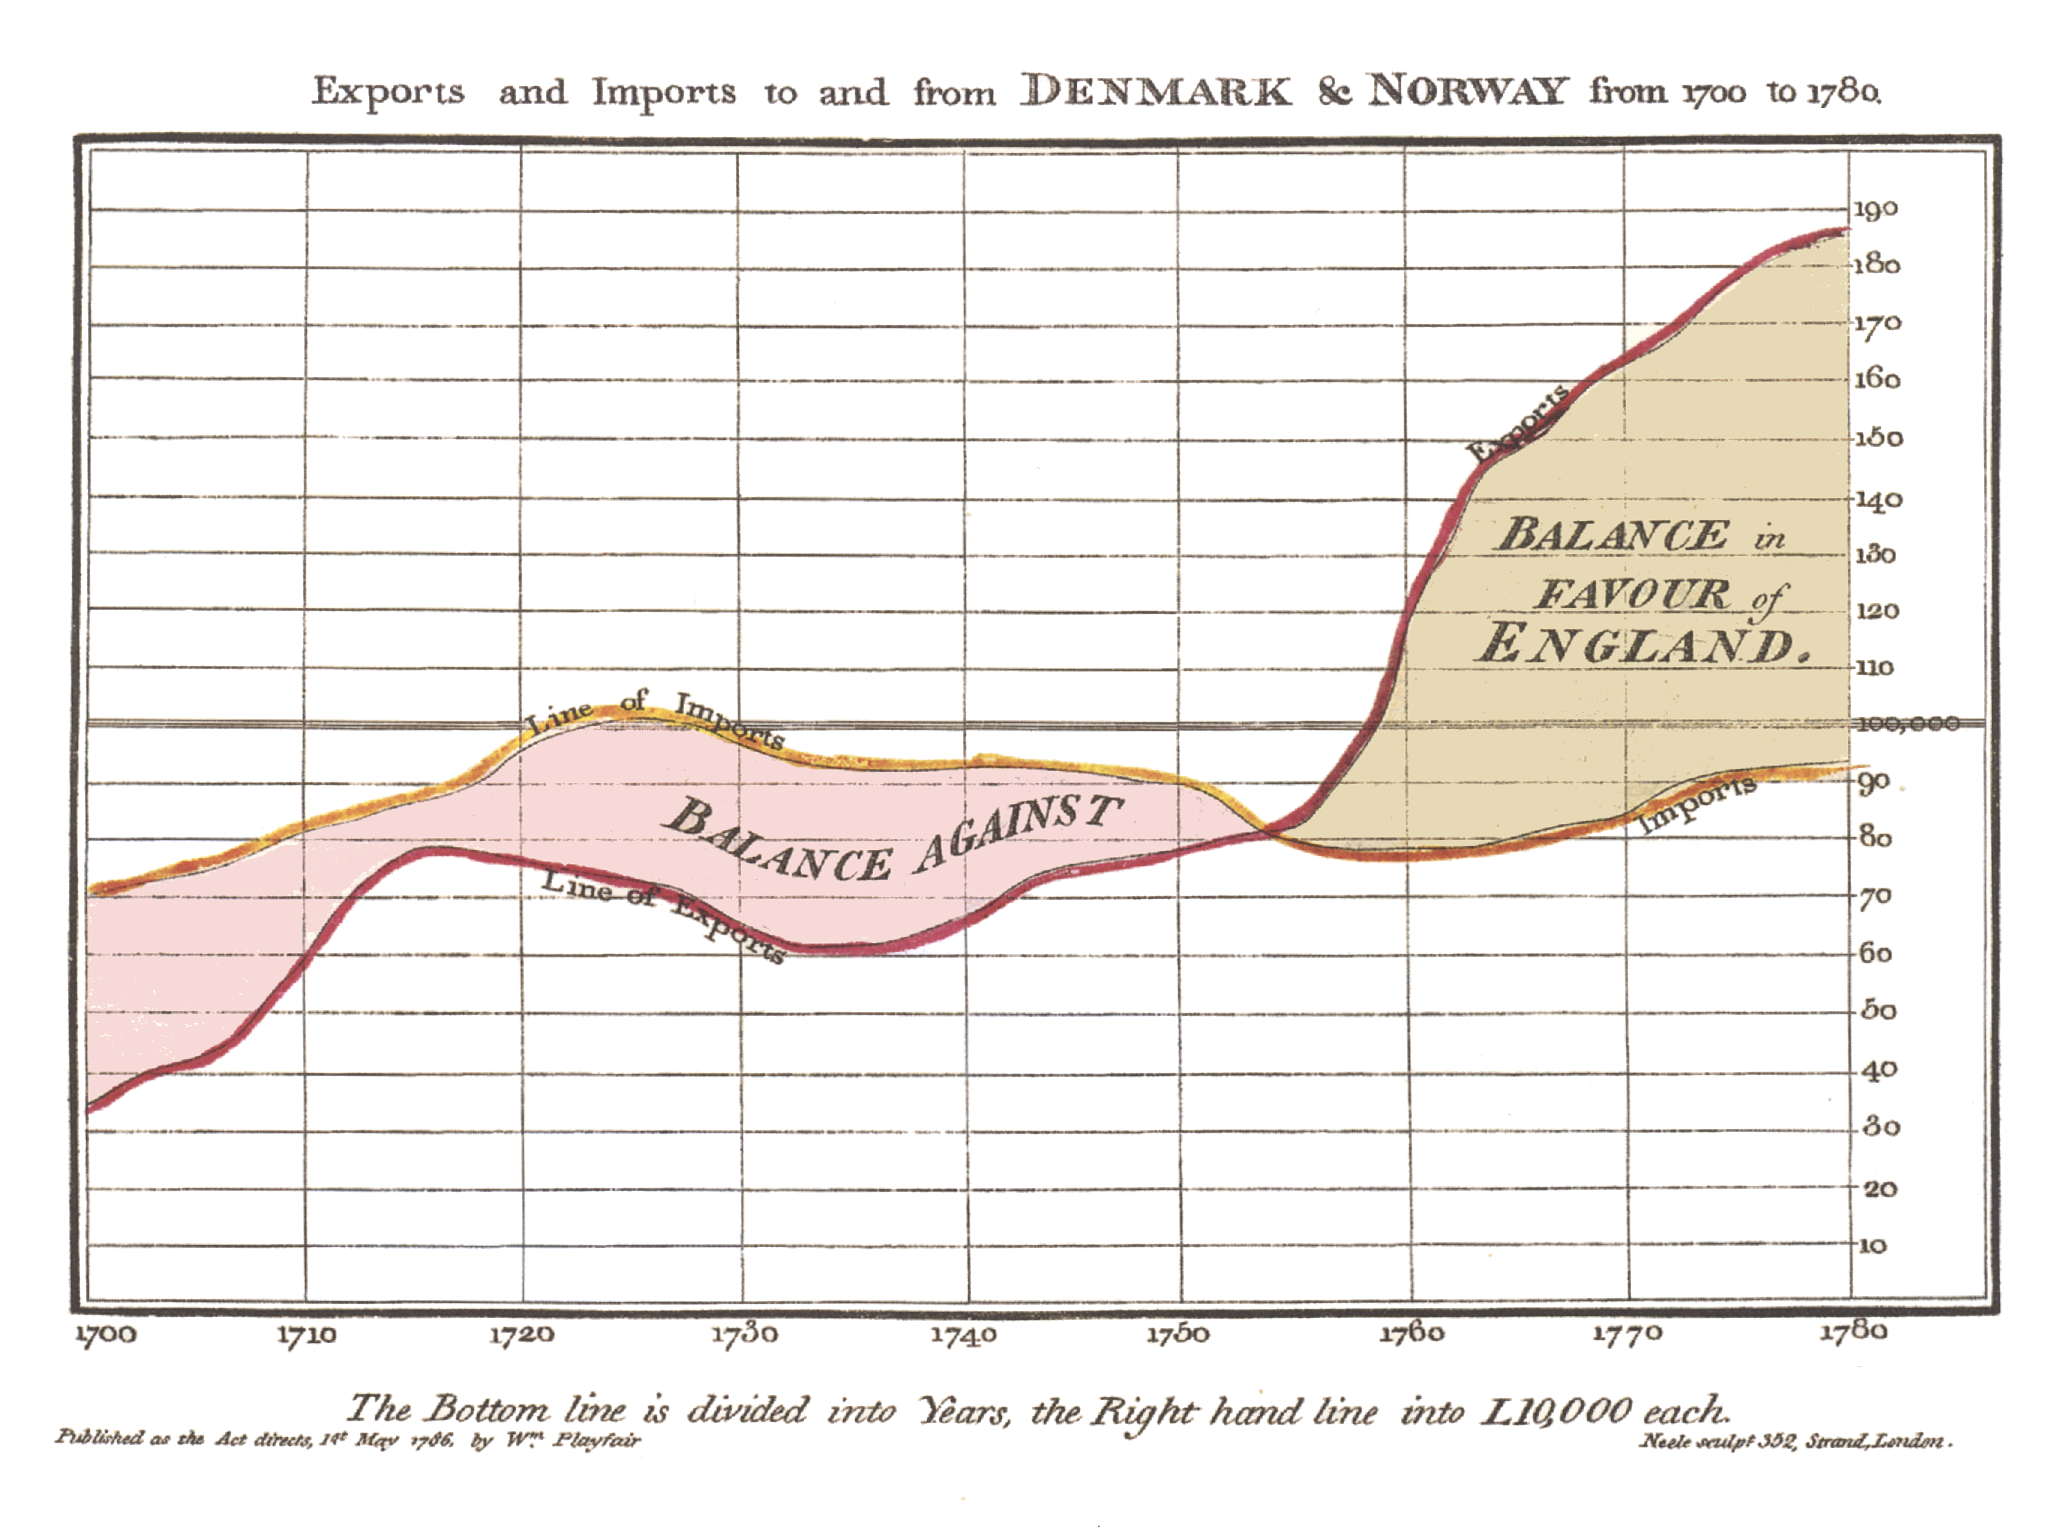
| Here is a pdf of this image with the text written in English. |
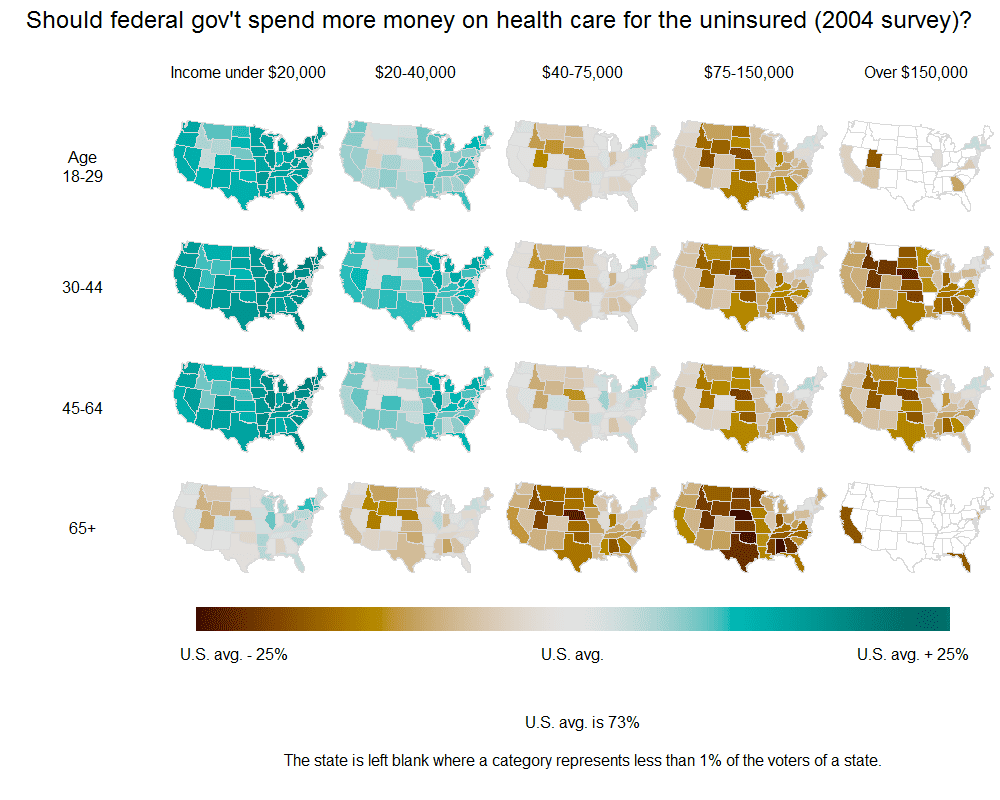
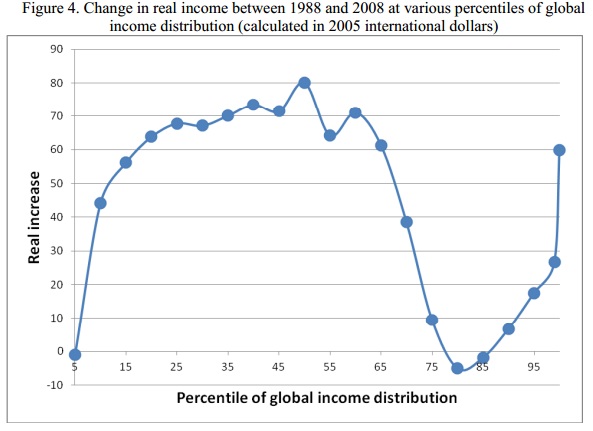
Economics is a discipline replete with graphs - see many examples in these "Best of" retrospectives by the BBC, Economist, Wonkblog and The Atlantic. Three of my personal favourites from across all of economics are: (1) Who Supports Health Care Reform in the U.S., (2) Changes in Real Income (1988-2008) by Percentiles of the Global Income Distribution and (3) the Mexican Lemon Imports - U.S. Highway Fatality Rate exposé.
Behavioural Science* has a similar abundance of interesting graphs but to date there hasn't been a retrospective on them. The approaching end of 2013 seems like a good time to do this. To that end, I asked people in the field as well as my colleagues in the Behavioural Science Centre for their favourite graph of the last 3 years. Many thanks to everyone for their recommendations.
THE 15 BEST BEHAVIOURAL SCIENCE GRAPHS 2010-13
Shlomo Benartzi and Richard Thaler have a graph showing an enormous growth trend over the last 10 years in the percentage of U.S. employers offering 401(k) plans that automatically enroll employees and automatically escalate savings rates (for example 3% savings this year increasing to 6% next year). This trend has been no doubt influenced by their Save More Tomorrow program which first implemented auto-escalating savings (see #4 here).

(2) Norton & Ariely (2011), Building a Better America-One Wealth Quintile at a Time, Perspectives on Psychological Science
Dan Ariely pointed me to a graph from his 2011 paper with Michael Norton about the American public's perception of wealth distribution in the United States. They asked a nationally representative sample (N= 5,221) what they considered to be the ideal wealth distribution in the U.S. and what they estimated it actually was. They then contrasted these numbers with the actual distribution. The results are rather jarring. Although the sample expressed a preference for a relatively equitable distribution, in reality the top 20% of Americans have around 85% of the wealth and the bottom two quintiles don't even register on the scale.

A YouTube user named politizane later looked at this data and turned it into this rather splendid video that justifiably went viral.

(3) Opower (2013)
John Balz recommends a lovely graph produced by the American utility company Opower showing how social traditions affect energy usage. The chart shows how average residential electricity consumption on 2012’s Super Bowl Sunday (broken up into 15-minute intervals) differed from a typical midwinter Sunday.

(4) Boyce, Wood & Brown (2010), The Dark Side of Conscientiousness, Journal of Research in Personality &
Boyce & Wood (2011), Personality Prior to Disability Determines Adaptation, Psychological Science
There is a famous 1978 study comparing the life satisfaction of recent lottery winners with a group who recently became paraplegic. The main finding was that those who won the lottery were not significantly happier day to day than those who had lost the ability to walk. That result, while striking, is however an average figure which potentially masks a lot of individual heterogeneity. It seems plausible that different kinds of people might react very differently to major life events and it seems reasonable that one factor governing the reaction might be personality. Centre members Christopher Boyce and Alex Wood have two graphs on that very topic, looking at differential responses to major life events as a function of personality traits.
Using an initial sample of 9,570, the graph on the left describes the life satisfaction of people who became unemployed in Year 1, broken down by +1SD and -1SD Conscientiousness. Although both groups become unhappier after becoming unemployed, by Year 3 the low C are ticking back up, while the high C group become more miserable.
The graph on the right uses a sample of 307 individuals who became disabled in Year 1, broken down by +1SD and -1SD Agreeableness. Those with high agreeableness recover to their original life satisfaction level by year 4 whereas the low group remain unhappy.

(5) Hoffman, Vohs & Baumeister (2012), What People Desire, Feel Conflicted About, and Try to Resist in Everyday Life, Psychological Science
Centre member Michael Daly nominated this wonderfully creative effort from Hoffman et al. This 4 dimensional graph shows the "degree to which participants’ desires conflicted with their goals as a function of the strength of the desire. The crossing horizontal and vertical lines indicate the grand means for conflict and strength in this sample. Results are shown for 14 different desire domains; the sizes of the pie charts represent the relative frequency of the desire. In each pie chart, the lighter portions indicate the probability of successfully controlling the desire (i.e., not enacting the desired behavior when attempting to resist it), whereas the darker portions indicate the probability of self-control failure".
So for example, eating (the largest pie-chart) is the desire which people feel most often and is resisted over three quarters of the time. Media use is the desire which people fail to resist the most.

(6) Falk & Szech (2013), Morals and Markets, Science.
Armin Falk sent a graph looking at the effect of market interaction on moral values. Specifically, he and his co-author hypothesized that market participation may corrode one's morals for three reasons: (i) Since it takes two people to make a trade, responsibility and guilt for an ethically dubious action may be diminished, (ii) markets reveal social information about prevailing norms - if I see you acting selfishly, I may be more inclined to be selfish as well and (iii) markets put a strong focus on negotiation and trading rather than the possible negative consequences of these actions.
This graph shows the percentage of participants in the authors' experiment who were willing to gas a mouse to death (for real) for a monetary equivalent of €10 or less. Those in the Individual group could either let the mouse live and get no money, or kill the mouse and get €10. The participants in the Bilateral and Multilateral Market groups were divided into buyers and sellers and had to bargain over killing a mouse for up to €20 split between them. In line with the hypotheses, those in the market groups were around 30 percentage points more likely to kill the mouse.

This graph is my own nomination. This paper examined 1,112 judicial rulings over a 10 month period by eight judges in Israel. These judges presided over 2 parole boards for four major prisons, processing around 40% of all parole requests in the country. They considered 14-35 cases per day for an average of six minutes and they took two daily food breaks (a late morning snack and lunch), dividing the day into three sessions.
The graph looks at the proportion of rulings in favor of parole by ordinal position (so 1st case of the day, then 2nd, then 3rd, etc). The circled points are the first decision in each of the three decision sessions, the tick marks on the x-axis denote every third case and the dotted line denotes a food break. The probability of the judges granting parole falls steadily from around 65% to nearly zero just before the break, before jumping back up again after they return to work.

(8) Mani, Mullainathan, Shafir & Zhao (2013), Poverty Impedes Cognitive Function, Science.
Several people nominated the graphs in this paper, the central hypothesis of which is that poverty directly worsens cognitive performance. The authors ran an experiment with 101 shoppers in a New Jersey mall. Before collecting demographic data that allowed the authors to categorize the shoppers as rich or poor, the shoppers were presented with a hypothetical scenario describing a financial problem: e.g. "Your car is having some trouble and requires $X to be fixed. You can pay in full, take a loan, or take a chance and forego the service at the moment... How would you go about making this decision?" Some shoppers were randomly assigned to the "easy" problem where the amount of money required was $150, others got the "hard" problem where they had to pay $1,500. The rationale is that poor and rich alike could probably manage to dig up $150 relatively easily, but figuring out how to find $1,500 at short notice would evoke more monetary concerns for the poor. The cognitive juggling this might necessitate, or the scarcity mindset it might engender, is what the authors argue impedes cognitive performance.
So, rich and poor alike got the 'easy' or 'hard' financial-problem prime. While mulling over how they'd solve this problem, they then had to complete Raven's matrices and cognitive control intelligence tasks. The graph describes the results: the rich and poor performed similarly on these intelligence tasks when mulling the 'easy' financial problem, but the poor performed much worse when both groups were digesting the 'hard' problem. Note also the elegant way significance levels are shown between and within groups.

Devin Pope sent this blockbuster of a graph. The authors investigated whether people use heuristics when buying a used car - specifically whether potential buyers focus on the left-most digit in the odometer in purchase decisions. The graph below uses a data-set of over 22 million used-car transactions and shows large, discontinuous drops in sales prices at 10,000 mile intervals in odometer mileage, as well as smaller drops in 1,000 mile thresholds. Because of the difference between observed sales prices and the prices expected if people were fully paying attention instead of using heuristic based judgment, the authors estimate that there is around $2.4 billion worth of mispricing in the market.

(10) Levitt, List & Syverson (2013), Toward an Understanding of Learning by Doing: Evidence from an Automobile Assembly Plant, NBER Working Paper.
A data-heavy graph from John List investigating to what extent the workers at a major car assembly plant learn-by-doing, taking advantage of the fact that the plant had just undergone a major reorganization and the workers had shifted to team-based production. Examining a period running from August to July when the plant produced 190,000 cars, the average number of defects per car started at 75 but fell to 25 eight weeks later. The average number of defects per car dropped to 10 soon after and remained there for the following eight months. The authors conservatively estimate that this improvement corresponds to $106 increased profit per car.

(11) ideas42 (2013), HIV Awareness in South Africa
The behavioural economics design lab ideas42 has been working with the Western Cape provincial government in South Africa to try to decrease HIV resulting from age disparate sex. Although older men are much more likely than younger men to have HIV, many young women incorrectly believe the opposite. This is unfortunate because sexual health, like buying a mortgage, is a domain where one bad decision can have life-long consequences. Since people generally don't get a lot of feedback on either of these decisions (a key requirement for developing expertise), bad decisions are lamentably common.
Ideas42 ran an experiment among 162 South African teens to try to correct this misperception of HIV prevalence. The treatment group played a 'guessing game' where they received demographic information (age and sex) about two randomly generated people and had to guess which one was more likely to get HIV. The control group read a pamphlet containing the same information. The teens' knowledge about HIV prevalence among younger and older men was then tested, the results of which are displayed in the graph. There was an enormous discrepancy in the first session (11% correct in the control vs. 67% in the treatment) but this gap narrowed over time, even though different teens were doing the experiment. By the final session 90% of the control and 100% of the treatment group were answering correctly .
Since ideas42 are reasonably sure that the same teens weren't doing the experiment multiple times, they attribute these learning effects to "treatment spillovers". In other words, between sessions the teens were talking to each other about what they had learned. Although you generally want to avoid this kind of contamination in experiments, in this case it was desired. The lab experiment was a prototype of an intervention currently under development. Since the final goal of the project is real-world social impact, these results show a tremendous potential for scale.

(12) Behavioural Insights Team (2013), Applying Behavioural Insights to Charitable Giving
The B.I.T. sent this graph looking at the power of social norms in charitable giving. Their motivation was that while 35% of people in a survey indicated a desire to leave money to charity in their will, only 7% of wills actually contain a charitable bequest. The team conducted a trial with the Co-operative Legal Services and Remember A Charity to see whether charitable giving could be supported in people's wills.
Before they began their intervention, the BIT looked at average charitable donations for a period of time to serve as a baseline figure. People on average donated £3,300 in their wills. After they began the intervention, thousands of customers who rang to book a will-writing appointment were randomly assigned to one of two teams of will-writers. The first team would take their details and then ask "would you like to leave any money to charity in your will?" (Plain Ask). The second team would instead ask "many of our customers like to leave money to charity in their will. Are there any causes you’re passionate about?” (Social Norm). While the Plain Ask method had essentially no effect on donations, the effects of the social normative nudge were enormous - doubling the average donation to £6,661.

(13) Lacetera, Macis & Slonim (2012), Will There Be Blood? Incentives and Displacement Effects in Pro-Social Behaviour, American Economic Journal
The World Health Organization and many national blood collection agencies operate on the principle that the blood supply system should be based on voluntary, undirected donations and that paying people to give blood would be detrimental both to the quantity and safety of the blood supply. This, however, is an assumption which has not been rigorously examined in the field.
Nicola Lacetera and his co-authors investigated this assumption using data from 500,000 blood donations in 14,000 American Red Cross (ARC) blood drives taking place over a period of 2 years. Of these blood drives, 37% offered some kind of incentive for blood donations (such as a blanket, t-shirt, coupon, etc.). Furthermore, because the ARC has limited funds it tries to allocate these incentives across its various host centres in a non-systematic way in order to treat all its hosts fairly. This is a fortuitous natural experiment - because the ARC essentially randomly distributes these incentives across different host locations, the authors do not have to worry a lot about selection bias among the blood donors.
The graph below describes the effect of providing incentives on blood donations. On average, offering incentives leads to 15-20% more donors presenting at a drive and more valuable incentives elicit more donations. Crucially, offering incentives does not increase the proportion of blood being deferred due to ineligibility (described by the purple line) - so paying people for their blood is not creating adverse selection where people with unsafe blood are more likely to donate.

(14) Paul Craven on the Herding Effect (2013)
This graph on herding behaviour by Paul Craven of Goldman Sachs really has to be seen in video form to be appreciated.

(15) The Many Labs Replication Project (2013)
Lastly, this majestic graph is the nominee of Centre Director Liam Delaney. This internationally cooperative study replicated 13 major psychology effects from over seven decades of research using 36 studies and a total sample of 6,344. The x-axis shows the standardized mean difference between the control and treatment group so the interpretation is that the further rightwards the dots are, the stronger the effect is. The blue X is the strength of the effect in the original paper. Eleven of the 13 effects seem to be robust, particularly the anchoring studies which replicate much stronger effects than the original papers. The priming studies did not replicate the effect.
 |
| The blue X's represent the effect size in the original paper. The large circles represent the aggregate effect size obtained across all participants. The error bars represent 99% confidence intervals. Small circles represent the effect size obtained within each study site. |
That concludes the Best of! Any omissions of great graphs are probably due to my lack of knowledge of the literature so please let me know if I've missed out on something. This is not a ranking.
*By "Behavioural Science" I mean papers from Behavioural Economics and the borderlands between economics and psychology more generally. The exact difference between Behavioural Science and Behavioural Economics is a matter of semantics to some, of deathly importance to others; I encourage you to read this Twitter conversation between Richard Thaler, Rory Sutherland, Dan Gilbert and others if you want to get a sense of it.
***UPDATE (20/12/13)
Since publishing this post I have received some emails about some graphs I missed. I have added them below.
Fehr, Herz & Wilkening (2013), The Lure of Authority: Motivation and Incentive Effects of Power, American Economic Review
Ernst Fehr sent a graph about the non-monetary value of power - specifically he and his co-authors investigated whether being in a position of power gives satisfaction above and beyond the accompanying monetary benefits. They conducted a computer-based experiment with 504 participants divided into four conditions. For each round of 10 total rounds, one participant was designated the 'Principal' and matched to another participant designated the 'Agent'. Each could receive monetary payoffs after choosing a 'project' in each round. The Principal had the power to choose the card but could delegate this power to the Agent, who could only recommend which card to choose. This delegation decision was informed by the Principal's beliefs about how much 'effort' the other person would exert at a certain stage in the game (see p2, paragraph 2). Without going into too much detail, the economically rational response for the Principal is to never delegate in the LOW and PLOW conditions and to always delegate in the HIGH and PHIGH conditions because this would maximize their expected income.
The graph describes the systematic deviations from rational behaviour observed in the experiment. The delegation rates on the left side (16.3% and 13.9%) are above the rational response rate of 0% but the authors think that this is because some participants experimented with different strategies before realising that never delegating was their best bet, rather than participants systematically delegating over the 10 rounds. The delegation rates on the right side (35.5% and 42.7%) are far below the predicted rate of 100%. In order words, many participants are choosing to retain their position of power even at a financial cost to themselves.

EPCOR (2010), Water Consumption in Canada during Olympic Hockey
Thanks to Elliot Ludvig for pointing out this graph to me, which is similar to #3 above. It shows water consumption (most of which is accounted for here by flushing toilets) in Edmonton, Canada during the Olympic Gold Medal Hockey game when Canada defeated the United States.

***UPDATE (7/1/14)
Chevalier & Marie (2013), Economic Uncertainty, Parental Selection, and the Criminal Activity of the 'Children of the Wall', Working Paper
Centre member David Comerford nominated these graphs by Arnaud Chevalier and Olivier Marie. After the collapse of the Berlin Wall in 1989, East Germany
experienced a very large, but temporary, drop in birth rates mostly driven by
economic uncertainty. This raises the possibility of a differential response to
this uncertainty in terms of fertility decisions – in other words certain
groups of people may have delayed having children until the economic future was more clear. The authors exploit this natural experiment by examining
whether the women in former East Germany who did give birth during this time (1991-1993) had children who were
more likely to be criminally active.
The graphs describes the arrest rate per 1,000 population in East and West Germany for cohorts aged 6-7, 10-11 and 16-17 between 1993 and 2011. The red bars capture the 'children of the wall' moving through time and show that they are significantly more likely (40%) to engage in crime

12 comments:
Should you not give some credit to "The visual display of quantitative information" by Edward Tufte, if only for drawing your attention to the first two graphs?
He does mention Tufte or perhaps that's an addition following your comment? For me, a mention of Florence Nightingale's use of graphics in showing death by sepsis vs battlefield in the Crimean War would have been welcome.
The Norton & Ariely paper's findings were mostly a result of the method they used. They asked people to think in terms of quintiles, which are really complicated to compute even if you know all of the raw numbers. Recent studies (see Eriksson & Simpson, 2012, and Chambers, Swan and Heesacker, 2013) do a better job at examining perceptions of income inequality.
There's an awesome graph on page 21 of this paper that might meet your criteria.
They compare people's ability to interpret the results of a study, in context of with and without identity threat tied to the outcome.
They separate people into high numeracy and low numeracy, and into liberal and conservative (as a proxy for "identity associated with gun control policy"). The results are quite spectacular.
http://www.cogsci.bme.hu/~ktkuser/KURZUSOK/BMETE47MC15/2013_2014_1/kahanEtAl2013.pdf
Jeepers. You would think Tufte invented graphical presentation / analysis.
All he has done has collected the works of the great who went before him and made money from them.
Try reading the The Elements of Graphing Data - W.S. Cleveland.
A good article and collection.
#5 by Hoffman, et.al. is helpful and interesting. One point: There appears to be an error in the description? --It first states the lighter shade portion of each pie chart circle represents the probability of successfully controlling the desire (not giving into the desire); and the darker portion indicates the probability of self-control failure (giving into the desire). --Then it refers to the Eating pie-chart, which has a little less than 25% in dark shade, BUT says this is resisted almost a quarter of the time. (?) --From the rest of the description it appears the dark shade does indicate self-control Failure?
Wasn't going to say anything, but... couldn't resist :-) David VH
Cheers David, you're correct that should read "three quarters". Thanks for giving in to your desire.
Tufte's contributions have long been absorbed by the graphics and visualization community who have gone on to far exceed his original, seminal contributions. The sad fact is that Tufte, at least as represented by his course, has not kept up with any of these developments. The verdict on this is from recent attendees who wanted a "refresher" or update relative to what he reviewed and taught years ago. Without exception they found that he was teaching the exact same material in the same format...nothing had changed from what he was doing 20 or more years ago...
Awesome, please do also pay attention to Wealth and Health of Nations - the mindgapper - See (and press the play-button!):
http://www.gapminder.org/world
1) iirc, there is a problem with #7, prisoners with lawyers get seen 1st (I remember when this came out, it was astonishing
2) IMO, tufe gets way to much credit for opinions; Naomi Robbins is much better, buy her book first
3) The *only* way to judge a graph is to show it to a random pool from the intended audience, and then to quiz them on how much they understand
to my knowledge, almost no one does this sort of $ experiment, so almost everything that is said about graphs is opinion
no one does the experiment partly cause it is $ (but there are a few a lady in michegan does breast cancer flyers for patients testing) and partly cause graphs , despite their importance, are a scattered non discipline; everyone uses them no one gets a phd in graphs
4) if you look at how a lot of graphs are made, they are still (!) made by rules devised in the era of pen and pencil (or rapidiograph or letraset) it is insane: we make graphs by rules designed to reduce the amount of effort with a , literally, pen and ruler (also, a lot of the 50s classical literature is totall obsolete due to this
I think the WeatherUnderground graphic for a partiuclar location's 10-day forecast is really good: if you look at it, it has temperature, barometric pressure, precipitation, date, day, day's expected high & low temperature range, wind speed, & whether it's is going to be clear/cloudy/sunny, so 8 pieces of information shown two-dimensionally, which i think is pretty good - that's a lot of information in a small space - and it is not too cluttered, either - here is the URL for it so you can see what I mean: http://www.wunderground.com/cgi-bin/findweather/getForecast?query=New+York%2C+NY
It's fine if you want to focus on Behavioral Economics. It's not fine to say that's all there is to Behavioral Science. How about a truth-in-advertising title that refers to "Behavioral Economics" if that's what you're covering?
Anthropology, Economics, Political Science, Psychology, Sociology (among others) are all Behavioral Sciences in any meaningful interpretation of the words. Defining Behavioral Science as Behavioral Economics, as you do in your footnote, is ridiculous.
Of course, whether any of them are "really" sciences is debatable, but this hardly distinguishes economics from the other fields. Or rather, if it does, it does so unfavorably, since Economics as practiced has a high ratio of ideology to evidence. And there are practitioners in most fields who do not claim to be doing science, behavioral or otherwise.
Thanks for an interesting set of graphs.
Post a Comment